Optimism Price Prediction as $700 Million Trading Volume Comes In – Time to Buy?

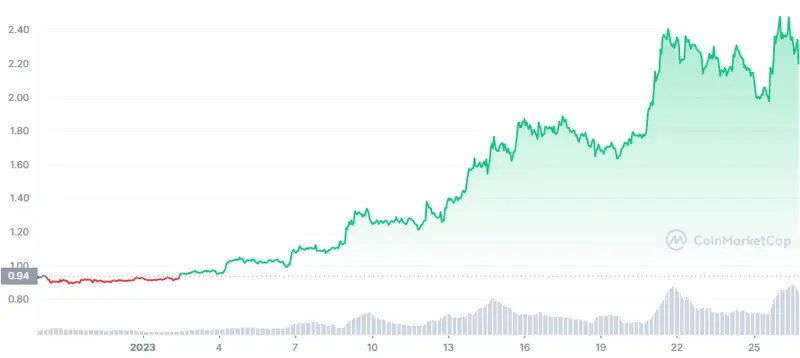
Optimism price rally to new all-time highs could be a harbinger of a better 2023, following a dismal performance in 2022. Over the last couple of weeks, Optimism’s value grew by 41% to trade at $2.36 at the time of writing. Cumulatively, investor holdings surged 147% in 30 days, pushing OP 479% above its all-time low of $0.40 on June 18, 2022.
Following that swing to a new all-time high of $2.50 on January 25, 2023, Optimism price is down 6.7%, as it absorbs increasing selling pressure, as investors cash out for profit. CoinMarketCap shows a massive spike in the 24-hour trading volume to $700 million.

Analysts have in the past concluded that large trading activities are an indication of investors taking on greater risks, which suggests numerous individuals are expecting OP to hit another all-time high. Put simply, there is optimism that OP price will exceed its previous peak.
What’s Driving Optimism Price Rally?
Apart from a generally bullish market, selected layer 2 protocols like Polygon and Optimism are performing incredibly well in 2023. The network is relatively new but has within a short time, caught the attention of both developers and investors.
Optimism is an Ethereum layer 2 protocol known for supporting scaling solutions. The network outlines that scaling blockchain transactions is the “end game” approach to taking cryptocurrencies mainstream and that can only be achieved by providing a higher transaction throughput while keeping costs down.
As a Layer 2 protocol executing on Ethereum, Optimism rolls out off-chain transactions in batches – assumed to be accurate and valid unless challenged through other mechanisms referred to as fraud proofs.
In other words, Optimism supports transactions off-chain, allowing for higher throughput. Subsequently, the same transactions are posted on the Ethereum blockchain. This way, using Optimism as the primary protocol, helps to bypass mainnet gas requirements and the associated network congestion.
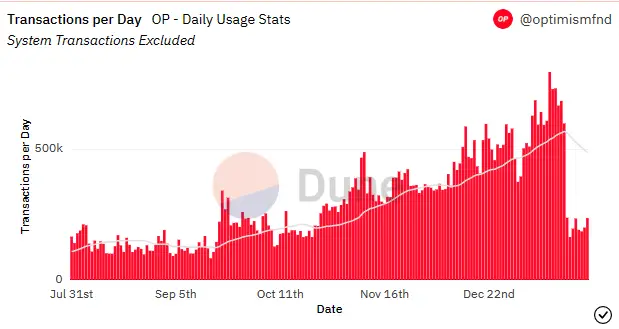
In recent weeks, there has been a sharp uptick in the use of Optimism, evidenced by the network’s ability to process over 800,000 transactions in 24 hours. This figure surpassed the Ethereum mainnet and Arbitrum combined.

Data from Dune Analytics reveals that Optimism experienced several impressive spikes in its daily active addresses, with more than 110,000 addresses transacting on December 22. Even after that figure declined to around 80,000, it was still higher than Arbitrum.
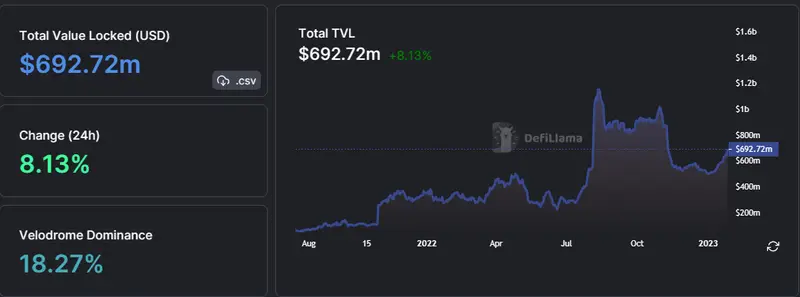
Optimism price rally may also be attributed to a tenacious growth in the total number of assets locked up in smart contracts. According to Defi Llama, the network boats $692 million in total valued locked (TVL) following an 8.13% increase in 24 hours.

Velodrome accounts for the lion’s share of the TVL at $126 million, with $125 million locked in Synthetix and $86 million in AAVE V3 staking platforms.
Optimism Price Pulls Back From $2.50, Should You Buy the Dip?
OP price has retreated from its all-time peak, possibly because investors are cashing out their profits. Investors who didn't take advantage of the upward momentum from early January may want to wait until the Optimism price is above the important $2.50 mark.
Additionally, there is a chance that the OP may see a correction, allowing those who have been sitting on the sidelines to capitalize on the trend. Based on Money Flow Index (MFI) indicator, there is still a higher influx of funds into OP markets, compared to the outflow volume.

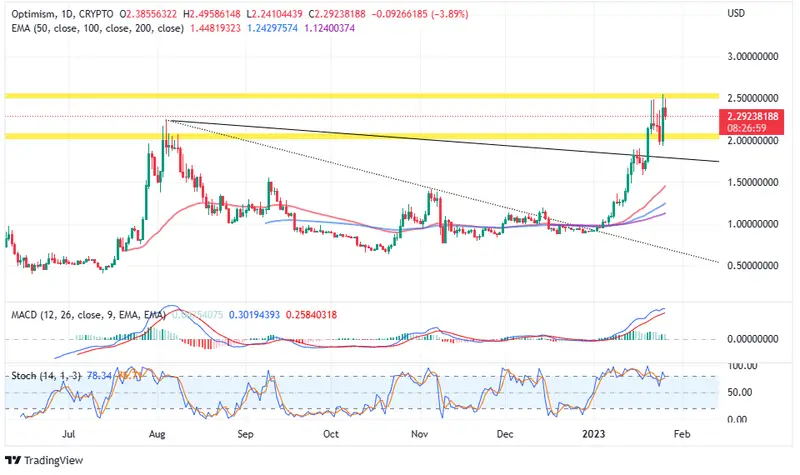
As the Stochastic oscillator slides into the neutral area from the overbought region, it shows Optimism price may take a breather from the rally to allow other macro factors to catch up with the sharp move. Investors shouldn't be alarmed because $2.00 support is still in place and OP has the potential to restart the rally.
If the pressure mounting on Optimism price due to excessive profiteering, overwhelms the bullish momentum, investors may be forced to settle for lower support provided by the 50-day Exponential Moving Average (EMA) (in red) at $1.50.
On the upside, Optimism price must break and hold above $2.50 – the upper yellow band, to affirm the bullish grip and set the pace for the next move to $3.00.
The same daily chart affirms the uptrend from the perspective of the Moving Average Convergence Divergence (MACD) indicator. Notice how bulls have defended a buy signal from early January and are likely to keep buying OP in upcoming sessions.
Traders considering shorting Optimism price may want to wait for the blue MACD line to cross beneath the red signal line, sending a sell signal. They should also be aware of a potential rebound at the $2.00 support level, as it could indicate a possible spike to new highs around $3.00.
Optimism Alternatives to Buy
If you're looking for other high-potential crypto projects alongside Optimism, we've reviewed the top 15 cryptocurrencies for 2023, as analyzed by the CryptoNews Industry Talk team.
The list is updated weekly with new altcoins and ICO projects.
Disclaimer: The Industry Talk section Features insights by crypto industry players and is not a part of the editorial content of Cryptonews.com.
Related Articles:
- Dogecoin Price Prediction as DOGE Falls 4.8% in 24 Hours – Time to Buy the Dip?
- Aptos Price Prediction as APT Pumps Up 37% in 24 Hours – Is Aptos the New Solana?
- Calvaria's Play-to-Earn Crypto Game Is Poised for Big Gains – Less Than $100,000 Left in Presale
Comments
Post a Comment